> ## Documentation Index
> Fetch the complete documentation index at: https://checkly-422f444a-onboarding-guides-plan.mintlify.site/llms.txt
> Use this file to discover all available pages before exploring further.
# Dashboards Overview
> Use dashboards to instantly communicate the health and performance of your checks.
**Monitoring as Code**: Learn more about [the Dashboard construct](/constructs/dashboard).
Dashboards provide a detailed way to communicate the status of your checks and monitors to internal and external audiences. Create professional, branded status displays for customers, internal teams, or specific stakeholders.
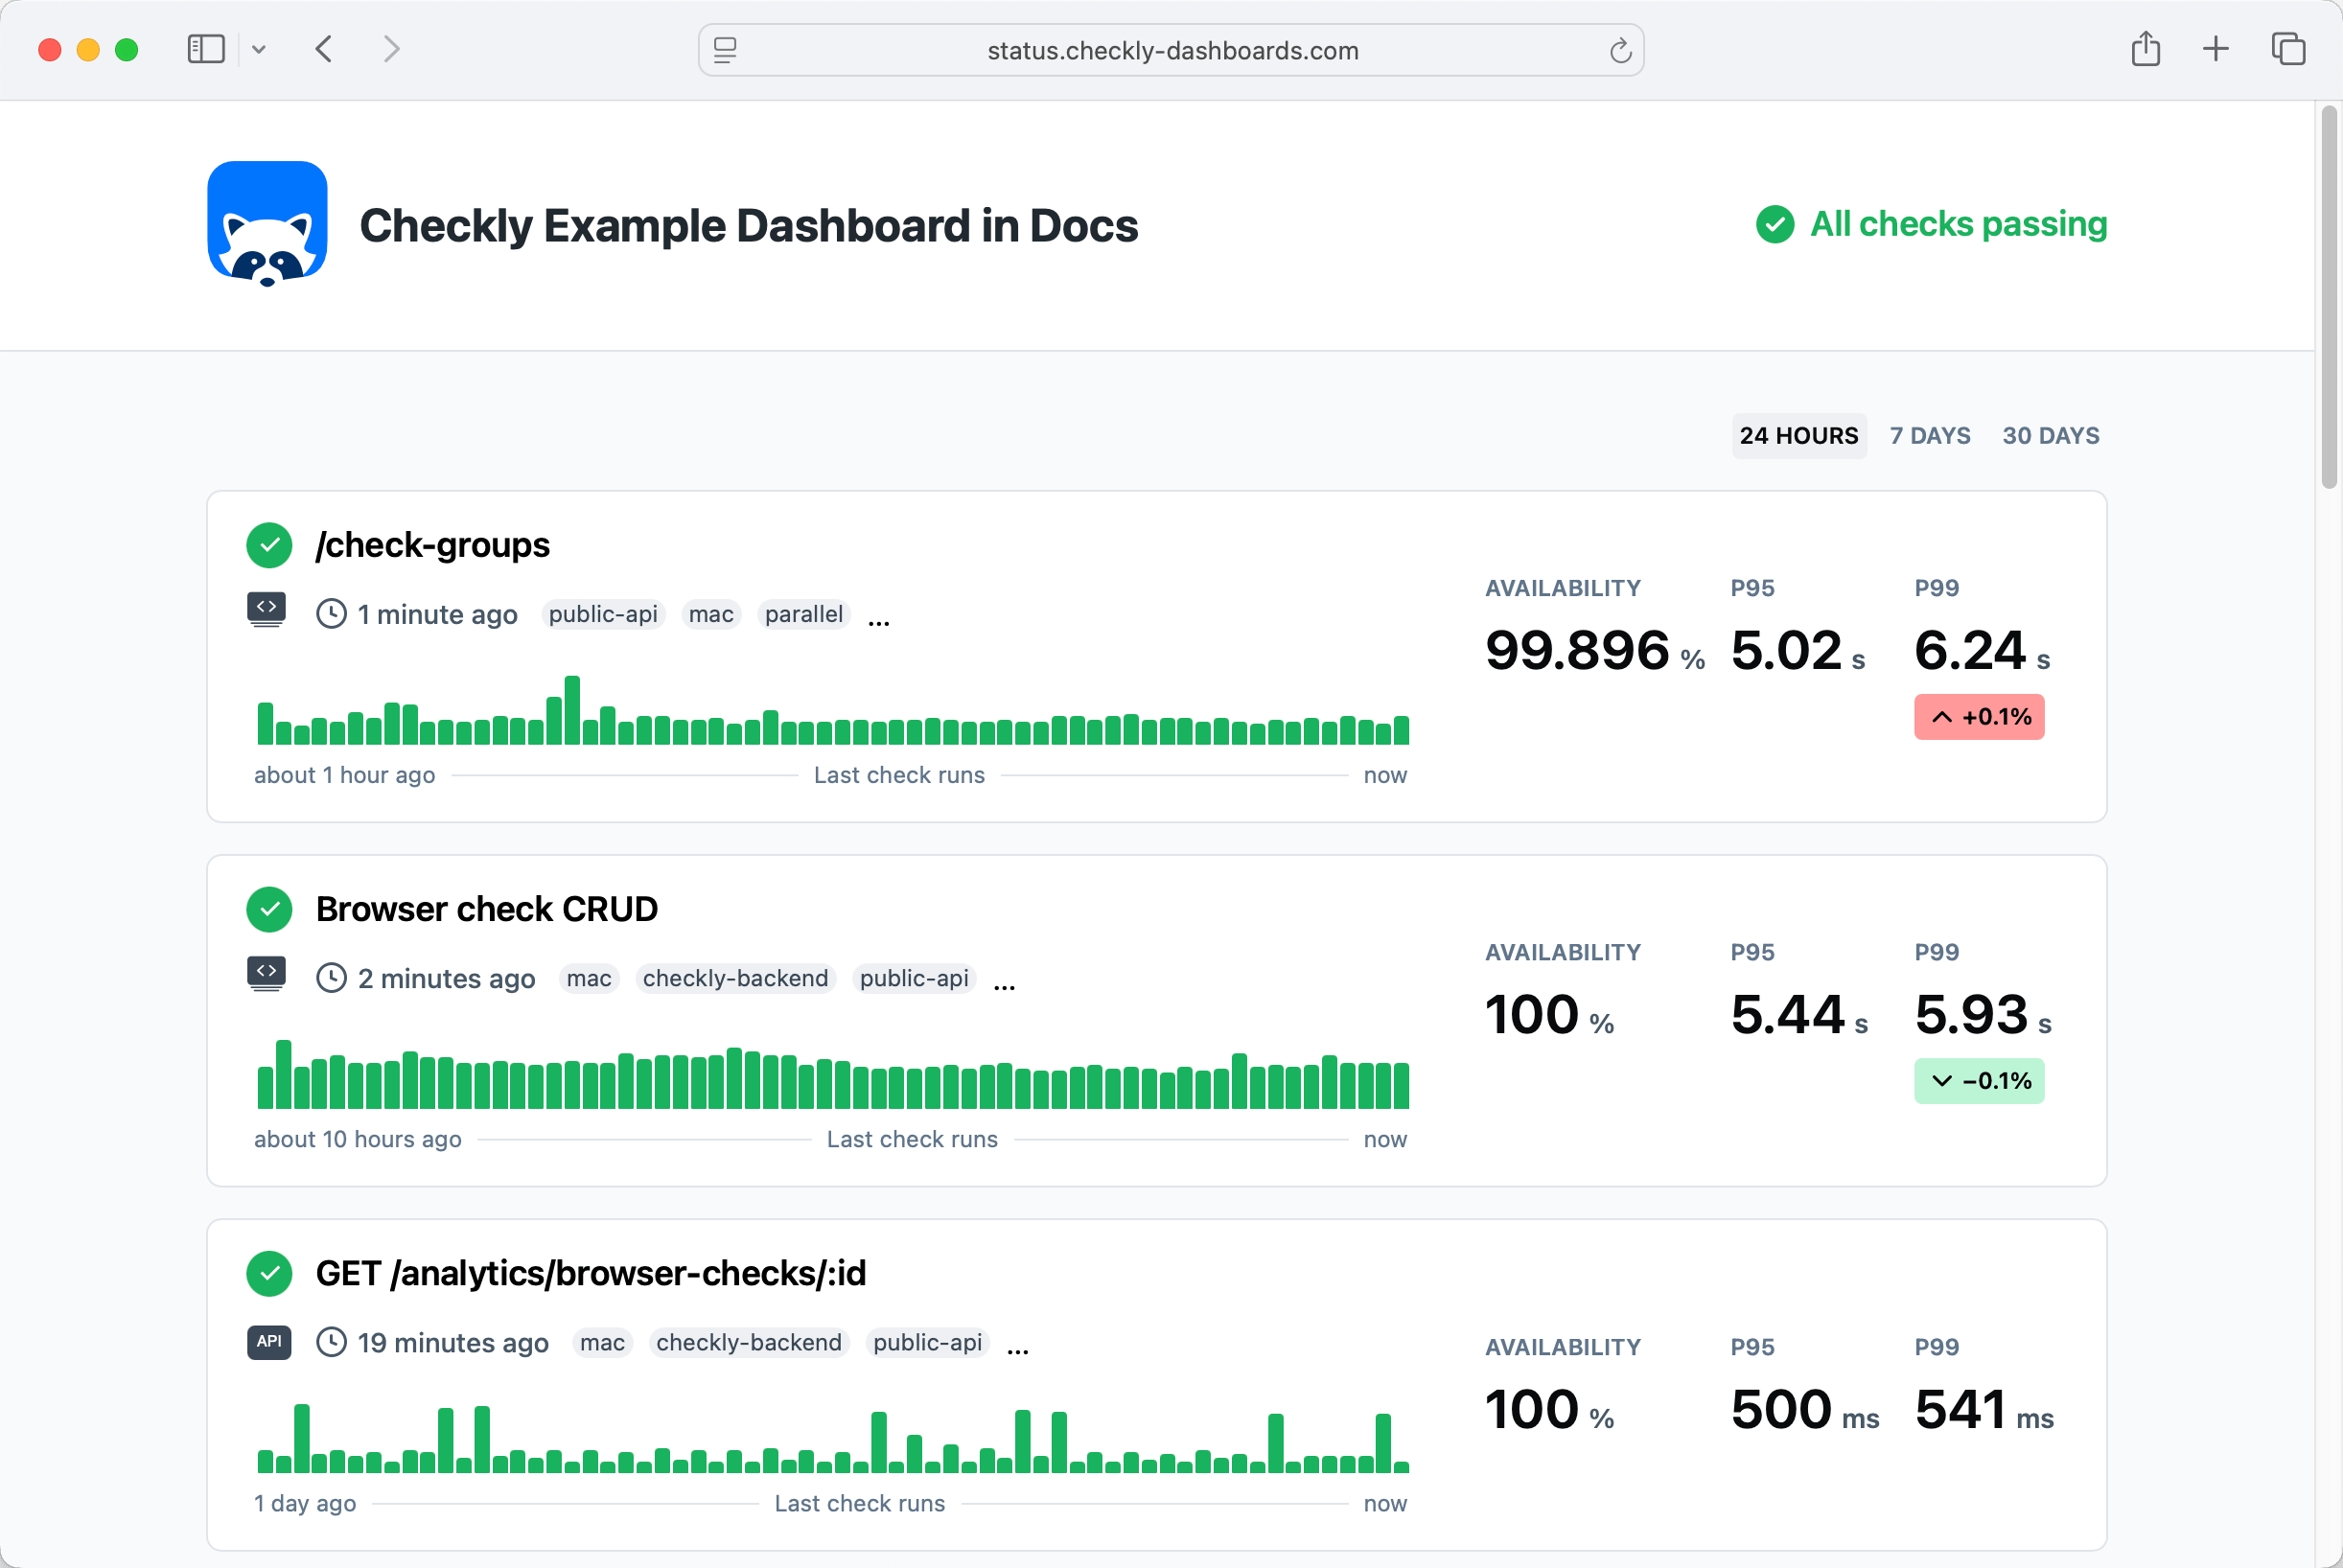 Dashboards allow you to do the following:
* Show the status of all your checks, or a subset by filtering by `tag`.
* Show the availability and p95 / p99 metrics over the last 24 hours, 7 days and 30 days.
* Communicate custom incident messages and maintenance messages.
You can create multiple, distinct dashboards based on your plan. Edit your dashboard by clicking on
the **Dashboards** button on the Checkly dashboard page.
*Check out our [Checkly Production Dashboard](https://status.checkly-dashboards.com) for a live example*
## Available metrics
Dashboards show the following metrics, depending on the check type:
| Metric | Description | Supported check types |
| - | - | - |
| **Availability** | Percentage of successful runs | All check types |
| **P95** | 95th percentile response time | All check types except Heartbeat & ICMP |
| **P99** | 99th percentile response time | All check types except Heartbeat & ICMP |
| **P95 Latency** | 95th percentile ping latency | ICMP |
| **P95 Loss** | 95th percentile packet loss | ICMP |
Metrics can be viewed over 1h, 3h, 24h, 7d, or 30d, based on your selected time range.
Dashboards allow you to do the following:
* Show the status of all your checks, or a subset by filtering by `tag`.
* Show the availability and p95 / p99 metrics over the last 24 hours, 7 days and 30 days.
* Communicate custom incident messages and maintenance messages.
You can create multiple, distinct dashboards based on your plan. Edit your dashboard by clicking on
the **Dashboards** button on the Checkly dashboard page.
*Check out our [Checkly Production Dashboard](https://status.checkly-dashboards.com) for a live example*
## Available metrics
Dashboards show the following metrics, depending on the check type:
| Metric | Description | Supported check types |
| - | - | - |
| **Availability** | Percentage of successful runs | All check types |
| **P95** | 95th percentile response time | All check types except Heartbeat & ICMP |
| **P99** | 99th percentile response time | All check types except Heartbeat & ICMP |
| **P95 Latency** | 95th percentile ping latency | ICMP |
| **P95 Loss** | 95th percentile packet loss | ICMP |
Metrics can be viewed over 1h, 3h, 24h, 7d, or 30d, based on your selected time range.